
Know What’s Working. Fix What Isn’t.
Signal Ridge builds KPI dashboards, scorecards, and reporting systems for teams who are tired of guessing from messy spreadsheets, exports, and disconnected tools.
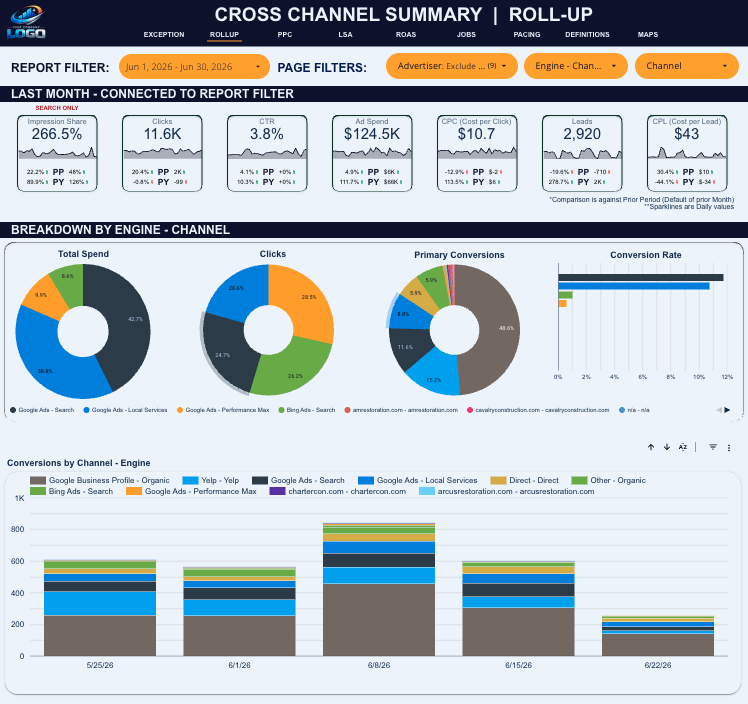
Marketing Performance Dashboard
Cross-channel reporting for ads, SEO, CRM, and lead sources in one trusted view.
Built for marketing agencies, home service businesses, and owner-led teams that need one trusted view of performance.
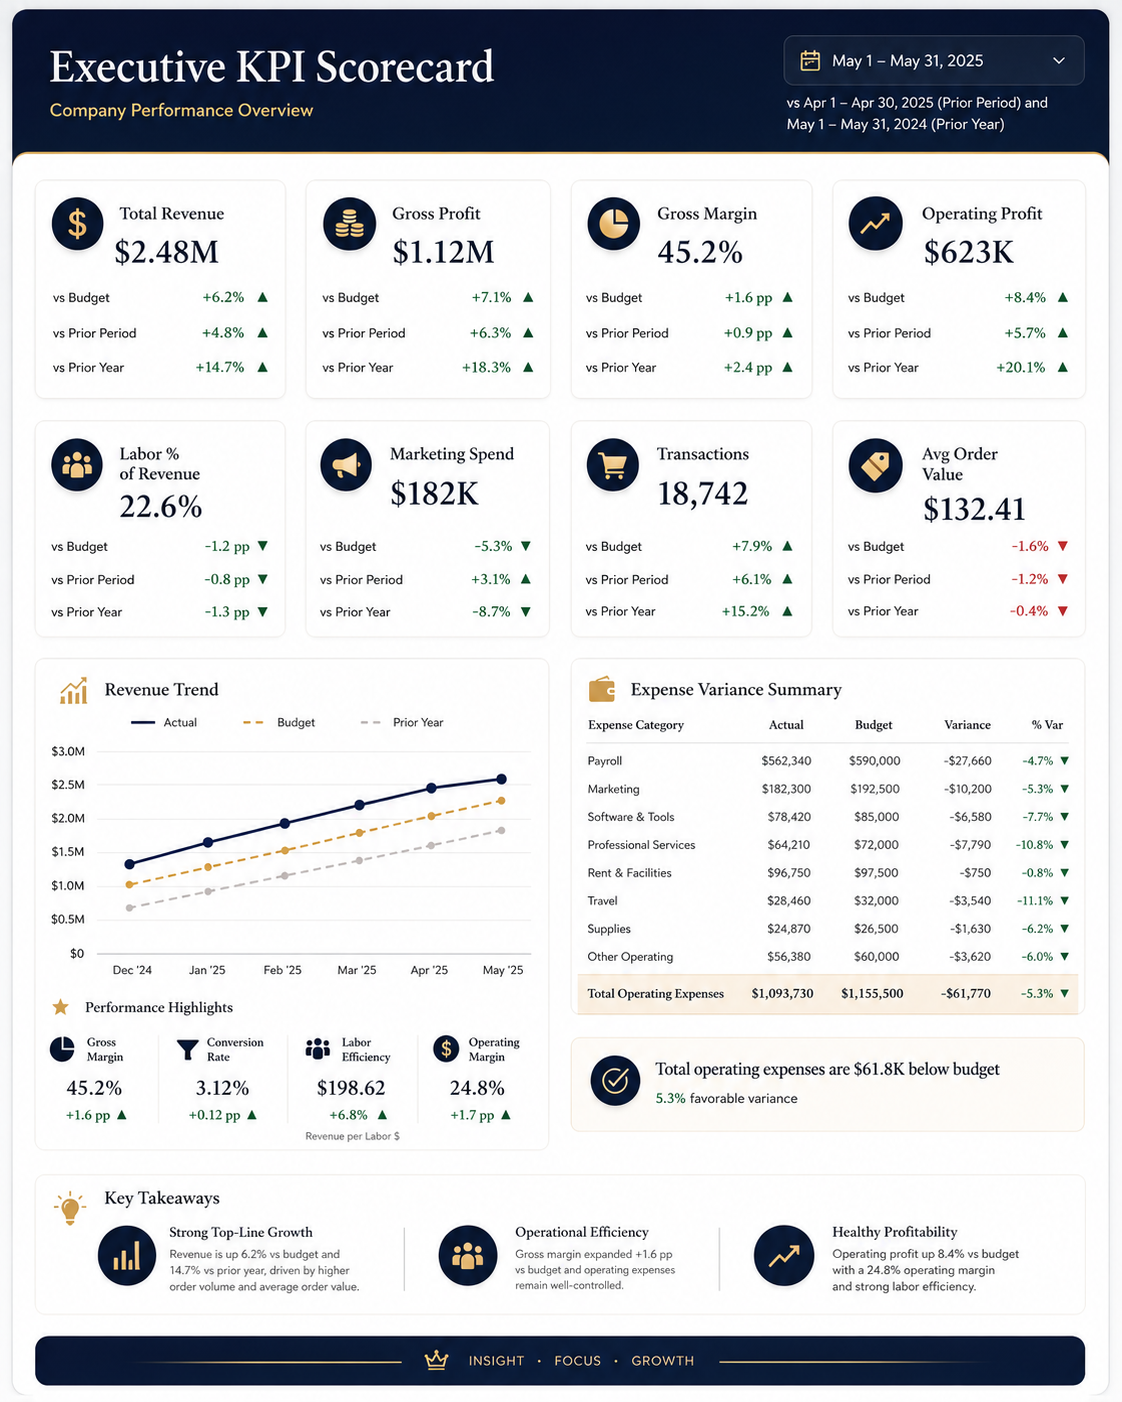
Executive KPI Scorecard
A leadership view of revenue, margin, expenses, and operating performance.
“Been working with Jamie for over 6-months on a Looker Studio project with extremely messy data structures. Jaime was on board to sift through the chaos and organize a layout to visualize our operational reporting in a reliable and scalable format. In addition to his technical abilities, he’s an excellent communicator/story teller and creating video feedback loops has sped up the process immensely. Highly reliable resource, will continue to lean on Jamie on more projects well into 2026!”
Less manual reporting. Faster decisions.
Most teams are stuck pulling numbers from ad platforms, accounting systems, POS tools, spreadsheets, and dashboards just to answer basic questions about performance. Signal Ridge standardizes the data flow so the numbers line up, the reporting stops wasting time, and the team can focus on what to fix next.
Stop stitching reports together
How Signal Ridge Works
Find the signal
We review your current reports, spreadsheets, dashboards, and operating rhythm to find where the numbers break down.
Build the system
We clean up the data flow, create the scorecards, and build dashboards your team can actually use.
Fix what isn’t working
We turn reporting into a decision rhythm, so your team knows what to fix next.

From scattered data to clearer decisions
The result is a cleaner system, faster answers, and dashboards built for decisions, not report theater. See performance by channel, campaign, and brand in one place, spot issues sooner, and give your team a reporting foundation that can actually scale.
What Clients Are Saying
"I worked with Jamie on a complex Looker Studio dashboard build backed by BigQuery, and he was excellent from start to finish. He has a deep understanding of Looker, strong visual design instincts, and is very thoughtful about how metrics are defined and presented. Jamie was reliable, communicative, and proactive in suggesting improvements as the project evolved. I’d absolutely work with him again and highly recommend him to anyone looking for a skilled Looker Studio expert."
— Mark H. | Founder | BI & Analytics Solution Architect
“Scorecards allowed for a much faster & timely understanding of our business performance with much less time & effort to obtain.”
— Dru Ernst | Owner | Dru Bru
“We no longer have layers of personnel tracking performance, we need A-Bay Engineers tools to enable our managers to quickly gain the insights they need from the data while wearing so many other hats too.”
— Ron Auberger | Vice President | ARM Global Solutions
“Been working with Jamie for over 6-months on a Looker Studio project with extremely messy data structures. Jaime was on board to sift through the chaos and organize a layout to visualize our operational reporting in a reliable and scalable format. In addition to his technical abilities, he's an excellent communicator/story teller and creating video feedback loops has sped up the process immensely. Highly reliable resource, will continue to lean on Jamie on more projects well into 2026!"
— Scott H. | Chief Branding Officer at Ram Jack Systems Distribution
“Data collection and integrity has massively improved. Not only are we saving time, we now have customized and interactive dashboards with consistent visualizations that have been very helpful in understanding and tying together all of our data.”
— Joseph Cuddihy | Resurgence Brewing Company
“Jamie has been a pivotal resource for our team in building and refining Looker Studio reporting. He’s helped us translate complex data from CallRail and multiple other sources into clear, automated, and visually usable dashboards that our team can actually work from. What sets Jamie apart is that he consistently looks beyond the immediate ask. If he sees an opportunity to automate a process, improve data clarity, or strengthen visualization, he proactively brings it forward. That kind of thinking has materially improved how we understand and use our data. I would recommend Jamie to anyone looking for help with data visualization, reporting automation, and making sense of complex data."
— Tracy H. | VP of Customer Experience & Delivery
“Jamie’s app and dashboard have provided a simple digestible format to record, read, and analyze our brewing data…we were able to reduce our grain bill by 10%, while achieving the same targets, leading to a net decrease in just under $4 per bbl in raw material costs.”
— Patrick Smith | Production Manager | Dru Bru