
Business reporting & automation
Turn scattered business data into reporting you can trust.
Connect your systems, agree on the numbers, and spend less time rebuilding reports—so your team can decide what happens next.
I’m Jamie Schild. I build connected reporting systems for owners, operations leaders and agency teams with recurring reporting needs.
Have a project in mind? Talk through the work with Jamie →
For your business
Connect the view across your business.
Bring sales, marketing, finance and operations data into dependable recurring reporting.
Business reporting & automation →For agency clients
Make client reporting consistent.
Standardize client reports, reduce preparation work and see where attention is needed across accounts.
Agency reporting systems →Client work
See the reporting behind the promise.
Dru Bru · Business reporting
Financial and operational data, connected.
Reporting that brings together QuickBooks, production ERP, distribution and payment data for operating decisions.
“Scorecards allowed for a much faster & timely understanding of our business performance with much less time & effort to obtain.”
Dru Ernst · Owner, Dru Bru
Explore the Dru Bru case study →Flood Digital · Agency reporting
Trust the tracking. Make the report useful.
Tracking audits, prioritized remediation plans and client dashboards that connect performance with the next question to investigate.
The case study explains the measurement work, reporting scope and limits of the evidence.
Explore the Flood Digital case study →Each engagement has its own scope. Client outcomes are not a forecast for another business. Browse more client work →
Find the bottleneck
What is making reporting harder than it should be?
The numbers disagree.
Sales, finance and marketing use different definitions or reporting periods. Start by tracing one disputed number.
Use the reconciliation checklist →The report takes too much work.
Exports, spreadsheet cleanup and repeated updates consume the week. Agree the rules, then make the flow repeatable.
Explore reporting automation →The dashboard does not guide action.
You can see what happened, but finding the cause still takes a separate investigation.
See a decision-focused example →A connected system your team can use.
We agree on the scope before building. A custom implementation can include:
- Connected source data with clear refresh and access requirements.
- Agreed KPI definitions and checks that make missing or conflicting data visible.
- A useful dashboard or recurring report built around the decisions it needs to support.
- Documentation and handoff so ownership and maintenance are clear.
Additional sources, ongoing support and AI-assisted summaries are scoped where appropriate. See how custom work starts →
Learn before you decide
Choose a useful first step.
Work through a guide.
Find practical checklists, reporting examples and client stories for business and agency needs. No email required to read.
Browse Insights & Guides →Read the blog →
Assess your reporting.
Choose your business or agency route, answer 10 questions and view your score, advice and resources before the optional email step.
Take the free reporting assessment →Ready to scope the work? Discuss a custom project. Have prepared data and a focused need? Compare packages and buy online.
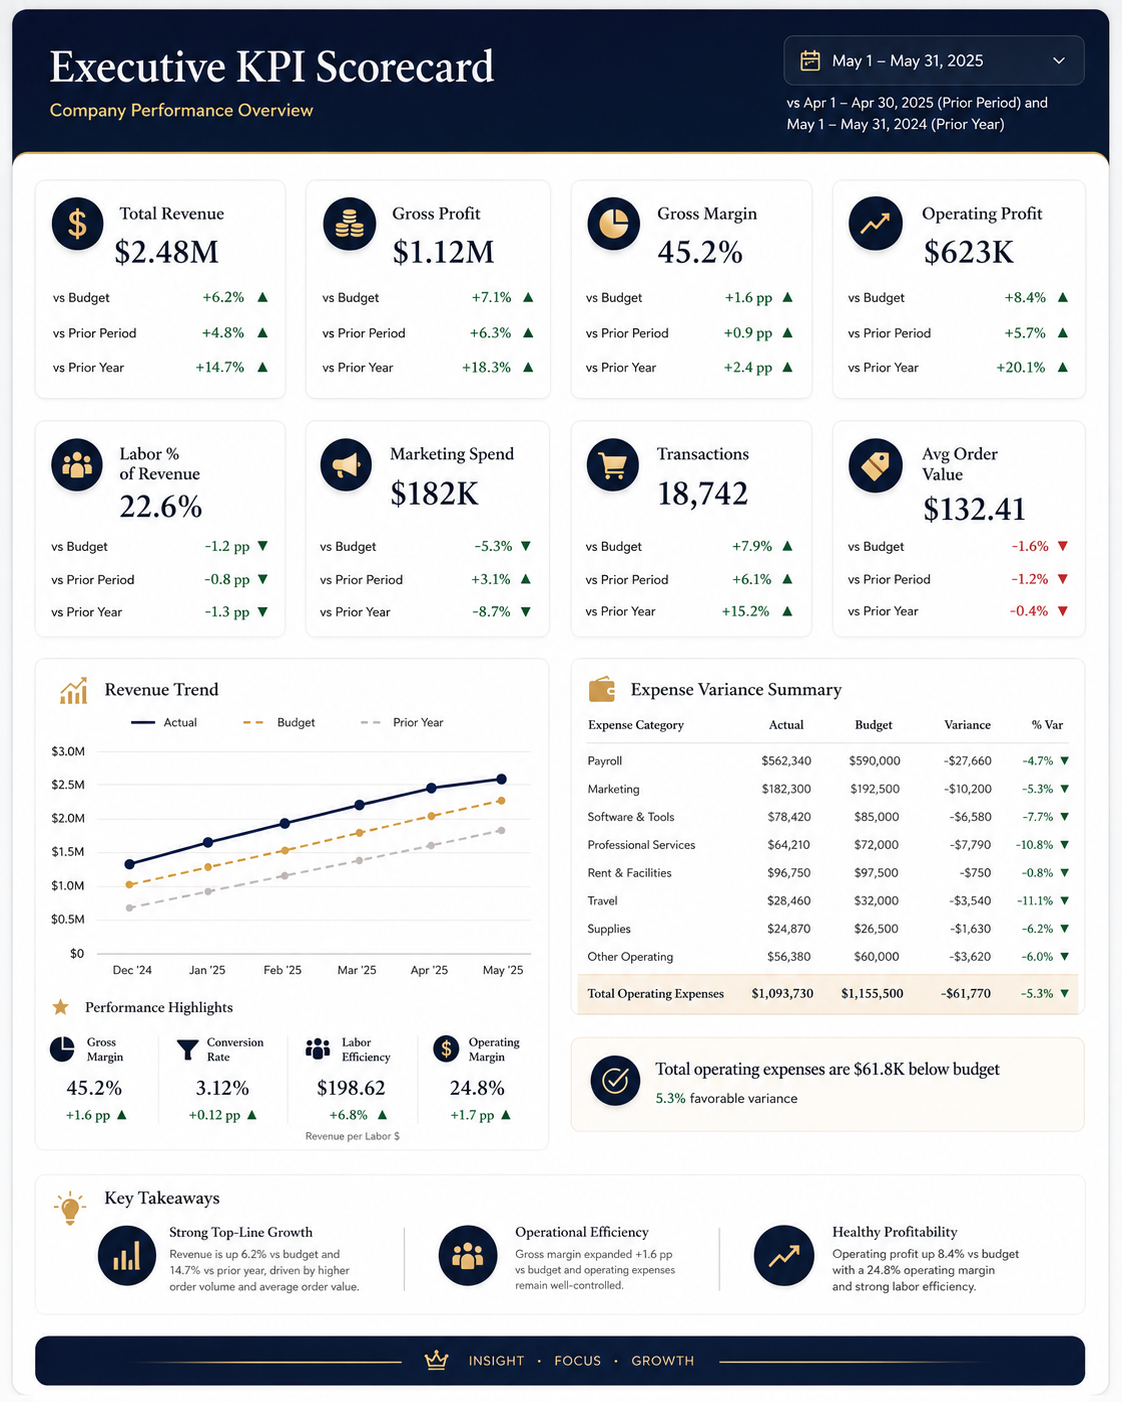
Executive KPI Scorecard
A leadership view of revenue, margin, expenses, and operating performance.
“Scorecards allowed for a much faster & timely understanding of our business performance with much less time & effort to obtain.”
Less manual reporting. Faster decisions.
Most teams are stuck pulling numbers from ad platforms, accounting systems, POS tools, spreadsheets, and dashboards just to answer basic questions about performance. Signal Ridge standardizes the data flow so the numbers line up, the reporting stops wasting time, and the team can focus on what to fix next.
Stop stitching reports together
What Clients Are Saying
“He has a deep understanding of Looker, strong visual design instincts, and is very thoughtful about how metrics are defined and presented.”
Mark H.
Founder · BI & Analytics Solution Architect
See how the reporting works in practice.
Dru Bru’s reporting brings accounting, production, distribution, and payment data into a clearer operating view.
“We need A-Bay Engineers tools to enable our managers to quickly gain the insights they need from the data while wearing so many other hats too.”
Ron Auberger
Vice President · ARM Global Solutions
“In addition to his technical abilities, he’s an excellent communicator/story teller and creating video feedback loops has sped up the process immensely.”
Scott H.
Chief Branding Officer · Ram Jack Systems Distribution
“Data collection and integrity has massively improved. Not only are we saving time, we now have customized and interactive dashboards with consistent visualizations.”
Joseph Cuddihy
Resurgence Brewing Company
“If he sees an opportunity to automate a process, improve data clarity, or strengthen visualization, he proactively brings it forward.”
Tracy H.
VP of Customer Experience & Delivery · Halstead Media
“We were able to reduce our grain bill by 10%, while achieving the same targets, leading to a net decrease in just under $4 per bbl in raw material costs.”
Patrick Smith
Production Manager · Dru Bru
How Signal Ridge Works
Find the signal
We review your current reports, spreadsheets, dashboards, and operating rhythm to find where the numbers break down.
Build the system
We clean up the data flow, create the scorecards, and build dashboards your team can actually use.
Fix what isn’t working
We turn reporting into a decision rhythm, so your team knows what to fix next.

From scattered data to clearer decisions
The result is a cleaner system, faster answers, and dashboards built for decisions, not report theater. See performance by channel, campaign, and brand in one place, spot issues sooner, and give your team a reporting foundation that can actually scale.