
Business reporting & automation
Stop rebuilding the same reports every week or month.
I’m Jamie Schild. I connect marketing, sales, financial and operational data into reporting your team can trust—with agreed KPIs, repeatable updates and clear ownership.
For owners and operations leaders who need dependable answers from systems that don’t line up.
When your reporting needs more than a template
Your systems disagree
Sales, marketing, finance, and operations each have a different version of performance. Connect the sources and agree on the definitions behind the numbers.
Your team rebuilds reports
Recurring exports, spreadsheet cleanup, and copy-and-paste updates eat into the week. Build repeatable data flows, scheduled reporting, and checks that reduce that work.
Your business has outgrown its dashboards
You need a view across brands, locations, clients, or business functions—with enough detail to understand what changed and where to investigate.
Business reporting in practice
From 11 spreadsheets to a connected operating view. Dru Bru’s production workflow brought brew-day and fermentation records into a single-entry app, with input limits and exception checks. The broader reporting work connected financial and operational sources.
Dru Bru: connecting QuickBooks, production ERP, distribution and payment data for operational and financial reporting. See the business reporting case study →
“Scorecards allowed for a much faster & timely understanding of our business performance with much less time & effort to obtain.”
— Dru Ernst, Owner, Dru Bru
Explore the case study for the report examples, production measures and attributed client feedback.
A useful starting point is one recurring management report and one decision it needs to support. We agree on the sources, metric definitions, checks and handoff before expanding.
What your team receives
A scoped implementation can include connected source data, documented KPI definitions, a dashboard or recurring report, agreed refresh and quality checks, and a practical handoff. Ongoing maintenance and additional sources are scoped separately.
Is this a fit?
You already have source data, a recurring reporting need and a person responsible for the decision. We need access to the relevant systems and someone who can explain how the numbers are used. If a change to your existing software solves the problem, we start there.
Before we start
What does a custom reporting project include?
We start with the decisions you need to make, the systems holding your data, and what is slowing your team down. The agreed scope can include data connections, SQL and BigQuery modeling, Looker Studio dashboards, Google Sheets or API automation, documentation, and handoff.
How are price and timeline determined?
Custom work is scoped before you commit. Data quality, source access, metric definitions, reporting views, and refresh needs determine the work. We agree on deliverables, acceptance criteria, price, and timing before implementation.
Can you improve an existing reporting system?
Yes. We can build on existing dashboards and data flows, fix inconsistent metrics, automate repeated tasks, or add reporting as your business changes. Ongoing support can be scoped separately.
Where does AI fit?
Reliable calculations come first. AI can then summarize changes and suggest what to investigate. Alert thresholds and refresh schedules are agreed with your team; freshness depends on the underlying source data.
Start with one disputed report
Use the reporting reconciliation checklist to agree definitions, trace differences to source records and decide what to automate first. Then see how a dashboard can support a specific decision.
Have a focused need with prepared data? Compare the fixed-scope reporting packages and buy online →
Reporting System Examples
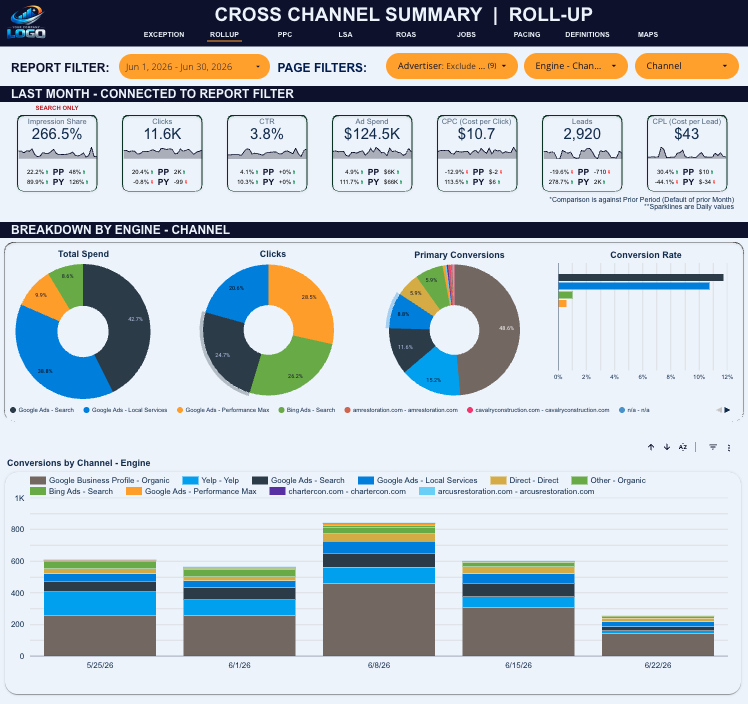
Marketing Performance Dashboard
Cross-channel reporting for agencies and marketing teams. Track Google Ads, Meta, SEO, CRM, and lead sources in one place.
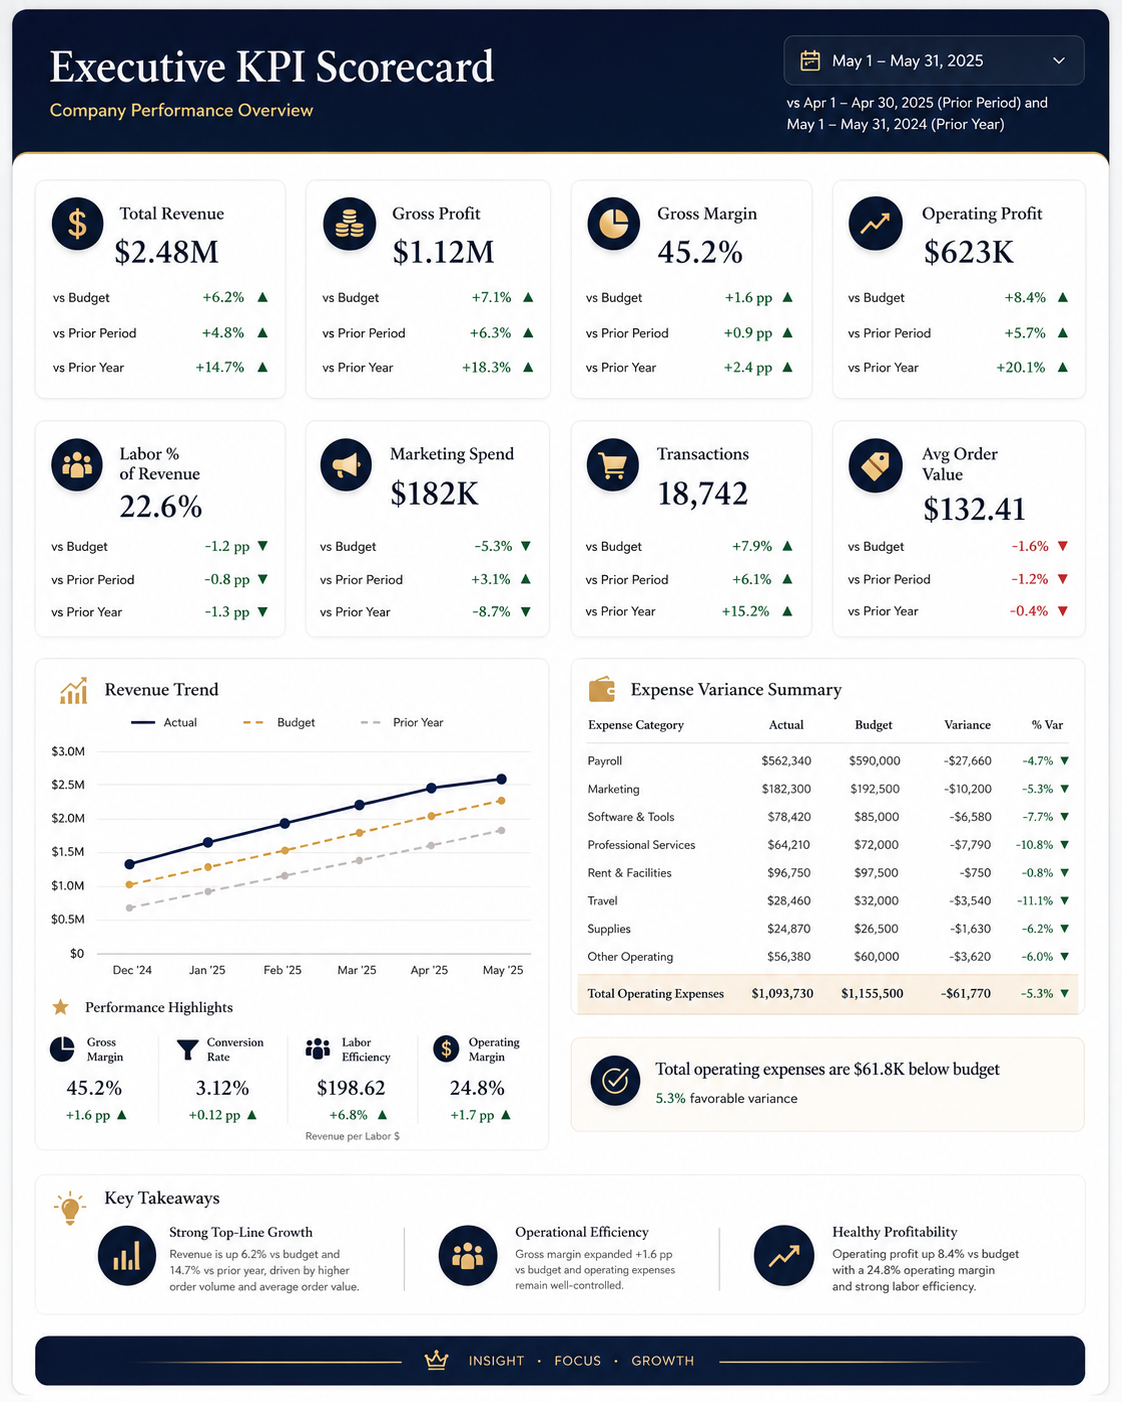
Executive KPI Scorecard
A leadership view of revenue, margin, budget variance, and operating performance — built to support faster, better decisions.
“Jamie has been a pivotal resource for our team in building and refining Looker Studio reporting. He’s helped us translate complex data from CallRail and multiple other sources into clear, automated, and visually usable dashboards that our team can actually work from. What sets Jamie apart is that he consistently looks beyond the immediate ask. If he sees an opportunity to automate a process, improve data clarity, or strengthen visualization, he proactively brings it forward. That kind of thinking has materially improved how we understand and use our data. I would recommend Jamie to anyone looking for help with data visualization, reporting automation, and making sense of complex data.”
Reporting System Buildout
We connect and organize the data behind your reporting system — from spreadsheets and CRMs to ad platforms, POS tools, and disconnected exports.
Clean up messy data flows
Standardize metrics and definitions
Build the reporting foundation your team can trust
KPI Dashboards + Scorecards
For owners and leadership teams that need one trusted view of performance.
Show what changed,
Spot where performance is drifting, and
Identify what needs attention next.
Ongoing Reporting Support
Need a system built around your business?
Bring your current reports, the systems your data lives in, and the decisions you need to make. We’ll identify the right starting point and scope the work before you commit.
Already know what you need? Compare packages and buy online →
For teams that need their reporting system to keep improving as the business changes.
We help maintain, refine, and expand your dashboards over time.
New platforms, new KPIs, cleaner definitions, better rollups, and sharper reporting rhythms
The system stays useful instead of slowly breaking.